A complete overview of your call center—what’s working and what isn’t—is essential to drive ongoing growth and improvement. Without comprehensive call center reporting, your data is just a jumble of numbers. With it, you can turn raw, unstructured information into actionable insights, enabling better CX, streamlined operations, targeted training, and stronger KPIs.
With 84 percent of service leaders stating that customer data and analytics are “very or extremely important” to achieving organizational goals, the need to understand your data is clear. But maybe a standalone reporting tool isn’t enough?
From talking to clients, listening to feedback, iterating and polishing—and polishing some more—we came to understand that better reports would be a nice-to-have, but they wouldn’t be a game-changer.
So we built a need-to-have. An entire new platform within a platform and a powerful data center for your contact center. It’s the most comprehensive QA business intelligence solution on the market—introducing Scorebuddy BI.
Scorebuddy BI seamlessly slots into your existing call center technology infrastructure to unlock the power of data. With Scorebuddy BI’s advanced, integrated reporting and analytics suite, you can paint a complete picture of your call center performance, make more informed business decisions, and turn your contact center data into a vital strategic tool.
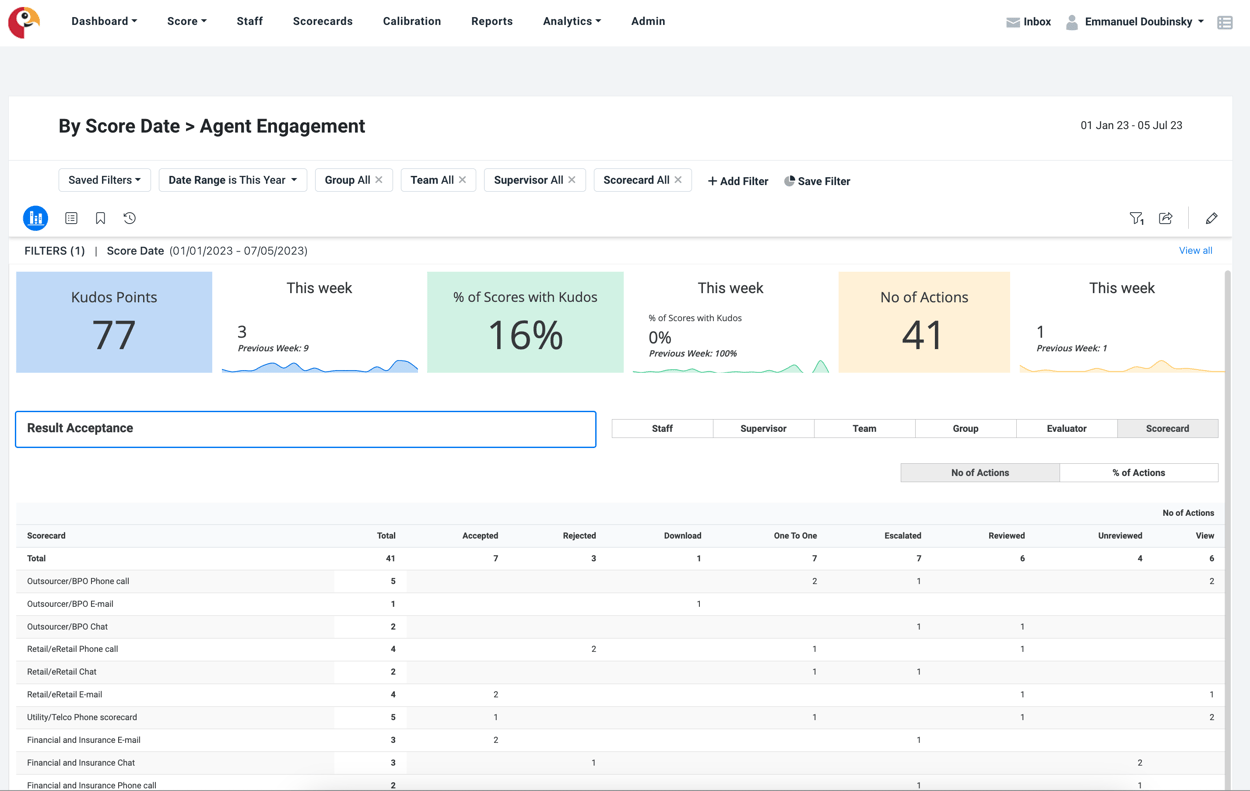
Drag-and-drop report building, intuitive navigation, customizable dashboards, simple collaboration—Scorebuddy BI digs into the depths of your QA data and delivers rich, accessible insights in a clear, visual format.

Scorebuddy BI gives you the power to slice and dice your data however you like. Forget the square peg, round hole templates of basic reporting tools, where you have to find workarounds to design the reports you need. Scorebuddy BI is completely flexible.
You can stay high-level and get a broad overview of your contact center reporting metrics. For example, if you want a quick performance snapshot to present at a board meeting or an investor presentation. And just as well you can zoom in on the specific call center KPIs you need. For instance, if you want to analyze the impact of an agent training program over time. Whatever your aims, Scorebuddy BI has got you covered.
Whether you want to refine workflows or pinpoint coaching opportunities, built-in filters allow you to go as granular as you want and focus on the most relevant data available. Want to know how Agent A compares to Agent B year-on-year in terms of first call resolution for customers dealing with billing issues? With Scorebuddy BI, you can find out in just a few clicks.
Scorebuddy BI embodies the difference between a simple reporting tool that delivers data and business intelligence that produces actionable insights. To paint a picture, a reporting tool might show that CSAT is down 5 percent over the past six months. A business intelligence solution like Scorebuddy BI will show you that it’s down because 52 percent of your agents have failed to complete your soft skills training program with a minimum grade of 80 percent. And that is something you can act on right away.
No more jumping between screens and manually pulling information from different platforms—Scorebuddy BI funnels all your data from every source into one central hub, so nothing slips through the cracks.
Connect disparate data for a complete overview of your contact center based on real-time information, ensuring alignment between departments. By linking sales and CS data, for example, you can identify opportunities to deliver personalized upselling and cross-selling.
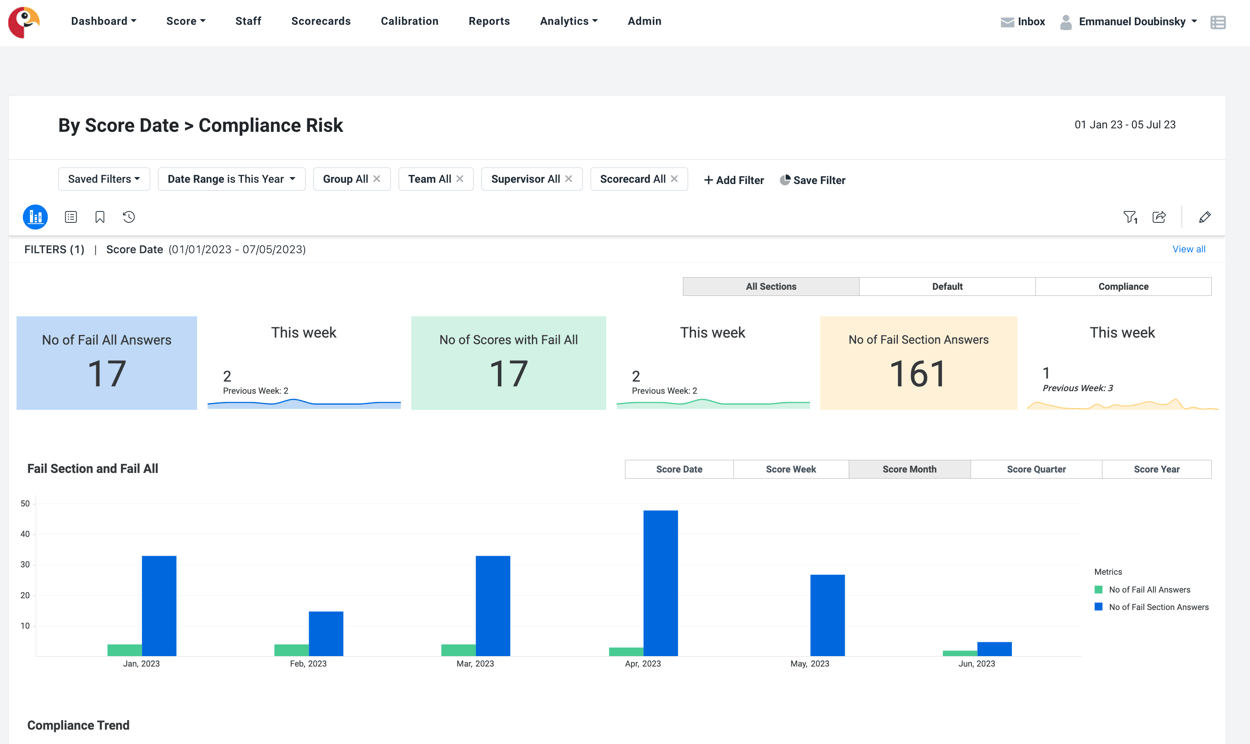
With everything in one place, you can eliminate data silos, visualize your data with full context, and get relevant insights instantly. Dynamic, interactive visuals and highly intuitive dashboards enable contextual, data-driven decision-making, with customization options to simplify even the most complicated information.
Maybe your average handling time is up and you want to fix this. You could create a report combining all relevant factors (time of call, type of call, talk time, hold time, etc.) and, at a glance, identify the cause like an overwhelming demand at peak times. To correct this, you could then provide more self-service options and increase staffing for peak hours.
With contact centers processing a ton of data every day, wading through all that information can be a challenge. Scorebuddy BI keeps your data organized, so you can switch between views and easily find the information you need. With intuitive navigation instead of complex, multi-layered paths, it’s easy to configure and view reports in any context.
Complex data doesn’t have to mean complicated reporting. By unifying all your data under one umbrella, you can get full visibility into every agent-customer interaction and identify opportunities to improve both the agent and customer experience.
This enables you to contrast and compare interaction outcomes, agent performance, customer satisfaction, and more by quickly switching views within the platform. Not only does this improve CSAT and engagement, it also illustrates the business value of QA.
With research finding that only 29 percent of companies are capable of analyzing customer journeys, this ability to generate a 360-degree view of every interaction is invaluable, enabling you to leverage personalized CX as a competitive differentiator. Using Scorebuddy BI, you can view these interactions from every angle.
Whether you want to start simple or dive in at the deep end, Scorebuddy BI is equipped to meet your needs. With out-of-the-box templates, as well as extensive customization options, you can pick a preset and jump in right away, or build multi-dimensional reports with ease.
Filtering allows you to drill down into the root causes behind your top-level reports. Maybe a snapshot report shows a high average hold time. A filter can show you that a technical issue with a new product is causing agents to place customers on excessive holds while they contact the tech department.
If you just want to get started, the option to select one of the built-in templates means you don’t need to be a data analyst—you can just open up Scorebuddy BI and unlock needle-moving insights right from the start.
Scorebuddy BI offers highly customizable, self-service reporting. You can unlock hidden QA insights in a few clicks by building drag-and-drop reports. No need to increase expenditure or hire external analysts, you can cut out the middleman and do it yourself.
Spend less time looking for insights and focus on taking action to improve operational efficiency, boost customer experience, and enhance agent performance—all while allocating fewer employees and resources to data collection and reporting.
No more limited, team-only views. A contact center is a collaborative environment and transparency between teams is essential to improve performance, increase trust, and boost morale. It’s an ecosystem where everyone is working together, and data accessibility supports this.
Share custom reports and collaborate with whomever you need—from your own team right up to C-level—even if they don’t have a Scorebuddy account. Build reports and share insights in just a few clicks so you can strike while the data is hot. Or if you want to really encourage in-depth analysis across the company, you can export and share the raw data as needed.
You may want to share scores for customer service metrics like CSAT, NPS, and customer effort scores to motivate agents, but you probably want to keep specific financials for the C-suite and relevant department heads private. With configurable permissions, you can decide the level of access, ensuring full control over the security and integrity of your call center reporting process.
This security, alongside intuitive, visual dashboards, encourages transparency and collaboration, so you can align all teams and departments around your wider business aims.
Collecting and analyzing data doesn’t have to be difficult. With Scorebuddy BI, you can uncover rich insights and leverage their strategic value. No complex reporting tools or external experts necessary—just an intuitive platform, clear-cut visuals, and instant access to custom reports.
The most comprehensive QA business intelligence solution on the market that slots right into your existing infrastructure and can be as simple or as in-depth as you want it to be.
Scorebuddy BI is here, and you can try it out right now. Explore the future of call center reporting and unlock the real value of your QA data of Scorebuddy BI today.