Are your customers happy with your service?
Are your call center agents doing their jobs and meeting business goals?
Is your call center as efficient, productive, and performing as well as possible?
To answer all of those questions, you need call center reports that you can review, analyze, and leverage to improve your operations.
Call center reports are the heart of any call center. That’s because they are responsible for gathering and assessing data about the effectiveness of your call center, your agents, and more. Without data, you cannot determine if you are meeting your goals, following correct processes, remaining compliant, and getting the outcomes you want.
Call center reports are invaluable tools for evaluating the quality of the customer experience and providing feedback on everything that happens within your contact center. When set up and used correctly, call center management reports can be used to:
The key is measuring the right call center quality metrics to tell exactly how you’re performing.

We’ve talked about call center KPIs many times on the Scorebuddy blog. Many available KPIs many available KPIs to help you measure everything from sales to productivity, customer satisfaction, and quality.
In general, your call center reports should break down your metrics into three sections:
Business-critical KPIs are concerned with your company’s procedures and how well you’re meeting your goals. These metrics should focus on employee engagement, customer satisfaction, and employee productivity.
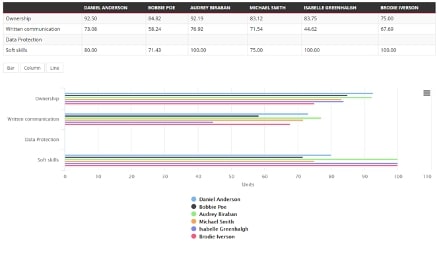
For example, Scorebuddy provides a call center report for all agents to see how well each individual meets specific business goals. In the example below, those goals are ownership of the interaction, written communication skills, data protection procedures, and soft skills demonstration.
Below is a shortlist of some of the most common customer critical KPIs used worldwide call centers.
However, metrics that examine the impact of customer emotions on your bottom line are missing from this list. You need to know how your customers feel after interacting with your agent.
To measure these less easily quantifiable metrics, you’ll need some call center quality monitoring report that allows your agents to review their empathy level and whether or not they went above and beyond for the customer.
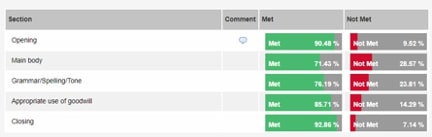
In Scorebuddy, you can track customer critical KPIs for each phone call to see if agents met or did not meet their requirements for the opening of the interaction, the main body, grammar/spelling/tone, empathy (use of goodwill), and the closing of the phone call.
Last but not least, process-critical KPIs are concerned with agent performance and whether or not your agent met the goals outlined for them. You want to answer how well the agent does their job professionally and with the necessary expertise. A typical KPI for this is a contact quality management score.
You might also measure how well your agents met the customer’s needs by having your agents check off boxes that answer critical questions, such as:
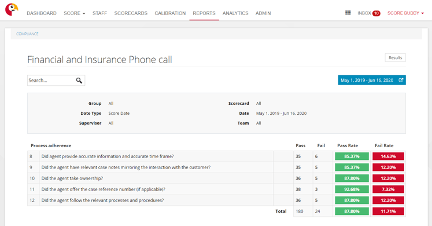
Here’s an example of how it looks to track process critical KPIs for a financial and insurance phone call in Scorebuddy. You can see the pass/fail rate for each process adherence question.
As for the metrics that should be on your call center reporting dashboard? That entirely depends on your needs and what’s important to you.
In general, you’ll want a dashboard that displays both quantitative and non-quantitative performance factors so you can work with your agents on improving behaviors that directly impact customer service. The goal of your reporting dashboard should be to help you improve quality control by telling you:
It’s up to you to determine which analytics on your reporting dashboard is best suited to provide insight into your customer experience and quality of service. The key is to empower your agents with data to encourage customer-oriented behaviors. And that’s why there is a multitude of powerful call center reports you can take advantage of.
Multi-channel contact centers need reports that are entirely customizable to their needs. There are a variety of approaches you can take, so for now; we’re just going to highlight five examples of call center reports that will have a significant impact on your call center.

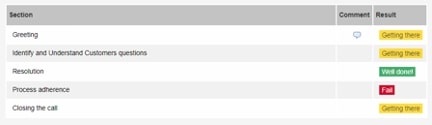
It’s critical that you can track how well your agents have adhered to your contact center procedures. To do that, you need a way to track and see your agents' actions.
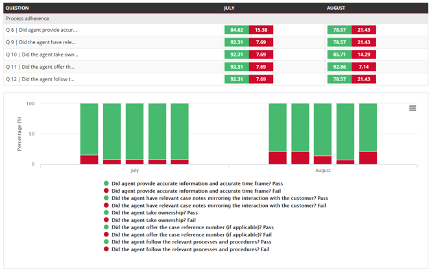
In this call center report sample from Scorebuddy, you can see a quick overview of how well a single agent adhered to the company’s processes for the months of July and August. In particular, the dashboard looks at the results of five questions:
In this call center management report, managers and agents can quickly look at productivity metrics to see how well they are meeting goals. Scorebuddy breaks down success or failure into three simple results: fail, getting there, or well done. In this case, areas for improvement and additional training can be easily identified.
There are many cases within a call center when you need to see a generic overview of agent performance. In this case, you may not be interested in specific interactions. Instead, you need an overview of every interaction and their performance to see if they are missing, meeting, or exceeding expectations.
In this Scorebuddy agent performance trend report, performance is broken down by week to look at how well the agent handled customer interactions.
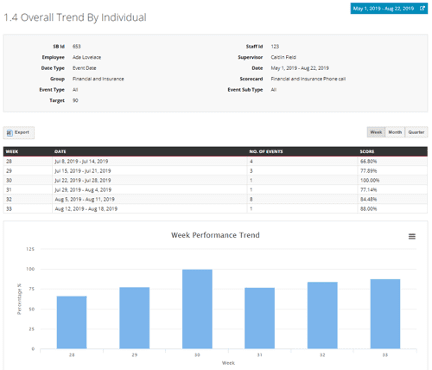
The above report gives a quick overview of how the agent is performing, but it does not provide enough specific insight to reveal training gaps or issues. To get this information, Scorebuddy provides an agent performance trend report.
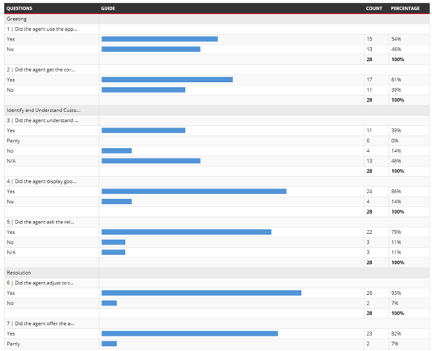
To meet expectations, the agent’s actions are broken into individual questions in this dashboard with a simple “yes” or “no” answer. If the “no” is a large percentage of results, you can identify a training need.
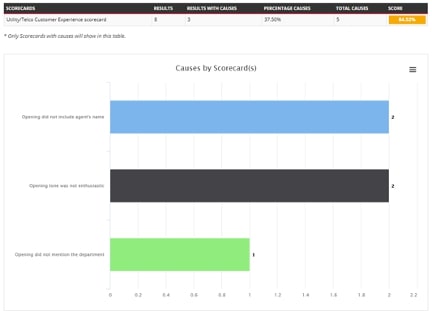
Below is another version of this data, which breaks down the action into specific negative results for a more detailed look at what needs to be improved. This is the Root Cause Analysis in Scorebuddy.
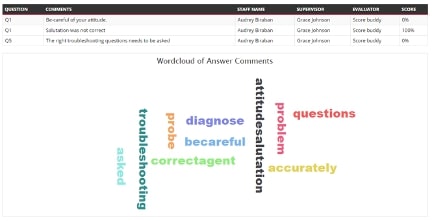
All of the above call center management reports focused on agent and general pass or fail results. And while that information is critical, it does not give the whole picture. You also need a call center report that highlights manager feedback to keep an eye on a priority area.
For example, in this Scorebuddy report, three key areas are highlighted for the agent:
There is also a word cloud of common comments to see what comes up most often. In this way, it’s easy to spot agent trends that need to be handled.
So what are you supposed to do with the above reports? First, take a deep breath. It's only data.
Analyzing call center reports can be daunting if you don't know what you are doing. However, if you follow these seven steps, you’ll be on your way to analyzing the data that you’ve gathered from all your quality monitoring scores.
As an analyst, you know that you can only be as good as the operational data. So, first and foremost, you need to make sure that you are gathering the correct data correct the KPIs you need most.
Remember to review your overall business and call center goals before setting your KPIs and the data you will collect. And don’t just focus on easily quantifiable data. Customer service-based metrics and questions are just as important.
To get started, there are a few critical questions you should consider:
You can more easily set actionable goals by answering these critical questions and thus outline the essential KPIs and data you need to track.
To make sense of data, you need it to be organized rationally. By reviewing a score here and there, you have no understanding of trends or whether the examples you are looking at are typical or not.
Clean, well-organized data is essential for successful analysis. This information will allow you to pull reports for any of these. Log all the details in the header of the scorecard.
Reports should match the categorizations of your organization: regions, departments, teams, functions, etc. You will need your words to be organized by dates too. Analyzing is closely linked to watching performance over time.
Logging quality assurance scores in a detailed manner means that you associate the scores with all the relevant categories; record the date of the interaction, the date of the evaluation, the evaluator's name, the agent, the team they are part of, their location, the channel the customer service interaction was through, the type of query; inbound/outbound/billing/complaint/product.

The head of your call center is a fountain of knowledge. There are essential questions related to success, productivity, and customer satisfaction that need to be answered. These questions and their answers are critical for quality assurance in the call center.
Now, set up reports to answer these questions. These questions will give you a tremendous overarching sense of performance and will provide a starting point you can work from for all further data analysis. It also allows you to speak the language of your head of the call center, which can help you communicate the significance of findings in a meaningful way.
The headline reports (as highlighted above) contain the most critical information about your success. Changes in these performances will make the most significant impact on your bottom line.
Examine these reports in detail, and if patterns emerge, get to the bottom of them by digging through the levels. You can uncover valuable insights through this root cause analysis method, identifying small changes that make a significant difference.
You need to analyze data by category and have a sound system to ensure you don't miss anything. To do this, you should list all the types you want to analyze to check for trends.
Below, we’ve developed a list of categories we recommend reporting on:
Analyze individual and comparison reports on each category. Then, tick items off the list as you work through them to ensure nothing is left out. This systematic routine will help you analyze call center reports consistently.
When you analyze data consistently, it's easy to forget what it is like for "non-data" people looking at your research. You need to translate all your data findings into plain English and explain them. Point towards the potential impact of each result and try to give examples.
The analysis is a waste of time unless decisions and actions are taken based on the results. Many organizations are analytics-driven and directed, which is lovely. Use your data analysis to start or fuel conversations and see real change.
As an analyst, you might not have all the answers. Yes, you might be able to allude to potential impact or reasoning. Still, results may resonate quicker with others in the organization who have specialized roles and have their 'ear to the ground' or 'finger on the pulse.' These eureka moments will only occur when people are engaged in positive discussions around a topic.
Knowledge is power; make your role more relevant by using a powerful quality monitoring analytics tool.